Infographics transform complex data into visual stories that captivate audiences and boost engagement. With Google’s Gemini AI, creating professional infographics has become remarkably accessible. This comprehensive guide shows you how to harness Gemini’s capabilities to design stunning infographics that communicate your message effectively.
Read Also: Unlock Gemini Pro’s Full Potential: 50+ Ready-to-Use Prompt Templates for Every Task
What Is Google’s Gemini and Why Use It for Infographics?
Google’s Gemini is an advanced multimodal AI assistant that understands text, images, code, and data. Unlike traditional design tools that require technical expertise, Gemini enables anyone to create infographics through conversational prompts. The AI assists with research, content structuring, color schemes, layout suggestions, and even generates visual elements.
The advantages of using Gemini for infographic creation include rapid prototyping, data-driven insights, customizable designs, and the ability to iterate instantly based on feedback. Whether you’re a marketer, educator, business owner, or content creator, Gemini democratizes professional design.
Getting Started with Gemini for Infographic Design
To begin creating infographics with Gemini, access the platform through Google AI Studio or integrated Google Workspace applications. Start by clearly defining your infographic’s purpose and target audience. Gemini works best when you provide specific context about your goals.
Prepare your data beforehand by organizing statistics, facts, and key messages you want to visualize. Consider your brand colors, preferred style (minimalist, bold, corporate, playful), and the platform where the infographic will be shared. This preparation ensures Gemini delivers relevant suggestions aligned with your vision.
Step-by-Step Process to Create Infographics with Gemini
Step 1: Define Your Topic and Objectives
Begin by telling Gemini exactly what you want to create. Use prompts like “I need an infographic about sustainable energy trends for a business audience” or “Create an educational infographic explaining the water cycle for middle school students.” The more specific you are, the better Gemini can tailor its assistance.
Step 2: Research and Content Development
Ask Gemini to research your topic and identify the most important data points to include. The AI can gather statistics, trends, and compelling facts that strengthen your narrative. Request Gemini to organize information hierarchically, ensuring your infographic flows logically from headline to conclusion.
Step 3: Structure and Layout Planning
Prompt Gemini to suggest infographic structures based on your content type. Common formats include timeline infographics for chronological information, comparison infographics for contrasting data, statistical infographics for number-heavy content, process infographics for step-by-step guides, and hierarchical infographics for organizational structures.
Ask Gemini to recommend optimal layouts that balance text and visual elements. The AI understands design principles like visual hierarchy, white space, and the rule of thirds, helping you create balanced compositions.
Step 4: Visual Element Generation
Request Gemini to suggest or generate visual components including icons, illustrations, charts, graphs, color palettes, and typography combinations. You can ask for specific styles such as “flat design icons for technology concepts” or “hand-drawn illustrations for an organic feel.”
Gemini can create SVG code for custom graphics, suggest appropriate chart types for your data, and recommend color schemes that enhance readability while matching your brand identity.
Read Also: Lovable VS Mocha: Which is the Best to Turn Your Idea to Apps (2025 Comparison)
Step 5: Content Optimization
Have Gemini refine your text for conciseness. Infographics require punchy, scannable content. Ask the AI to condense paragraphs into bullet points, create compelling headlines, and write clear data labels that enhance comprehension without cluttering the design.
Step 6: Assembly and Export
While Gemini doesn’t directly export finished infographics, it can generate HTML/CSS code, SVG graphics, or detailed specifications you can implement in design tools like Canva, Adobe Illustrator, or Figma. Alternatively, Gemini can create React components or HTML artifacts that render interactive infographics directly in your browser.
Advanced Techniques for Professional Results
To elevate your infographic quality, leverage these advanced Gemini capabilities. Request data visualization recommendations based on statistical best practices. Gemini understands when to use bar charts versus pie charts, line graphs versus scatter plots, ensuring your data is represented accurately and effectively.
Ask Gemini to critique your draft infographics, providing feedback on visual balance, color contrast for accessibility, text readability, and logical flow. The AI can spot issues human eyes might miss and suggest improvements.
Create interactive infographics by requesting Gemini to generate HTML and JavaScript code. Interactive elements like hover effects, clickable sections, and animated transitions increase engagement and are perfect for digital platforms.
Ensure your infographics are accessible by asking Gemini to check color contrast ratios, suggest alt text for screen readers, and recommend font sizes that meet WCAG guidelines. Inclusive design expands your audience reach.
Practical Prompts to Get Started
Use these proven prompts to guide Gemini in creating compelling infographics:
“Generate a color palette for a health and wellness infographic that feels calm and trustworthy.”
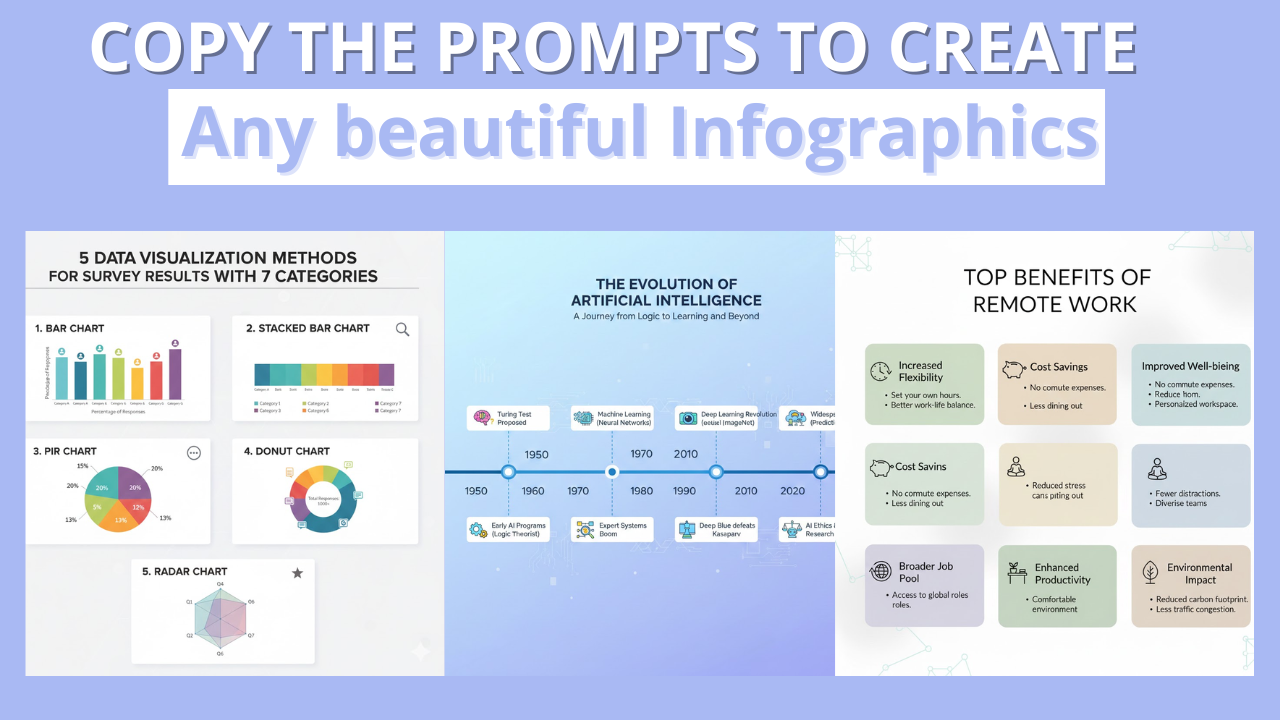
“Create a timeline layout for an infographic showing the evolution of artificial intelligence from 1950 to 2025.”
“Suggest five data visualization methods for displaying survey results with seven categories.”
“Write concise bullet points summarizing the top benefits of remote work, optimized for an infographic.”
“Design an icon set representing renewable energy sources: solar, wind, hydro, and geothermal.”
“Generate HTML code for an interactive infographic comparing product features across three pricing tiers.”
Read Also: 30 ChatGPT Tips and Tricks to 10X Your Productivity Right Now!
Common Mistakes to Avoid
Even with AI assistance, certain pitfalls can undermine your infographic’s effectiveness. Avoid information overload by focusing on three to five key messages rather than cramming excessive data. Gemini can help you prioritize the most impactful information.
Don’t neglect white space. Cramped designs feel overwhelming and reduce comprehension. Ask Gemini to ensure adequate breathing room between elements. Maintain consistent styling throughout by establishing clear guidelines for fonts, colors, and icon styles at the project’s start.
Always verify data accuracy. While Gemini is highly capable, cross-reference important statistics with authoritative sources. Finally, optimize for your intended platform by considering whether your infographic will be viewed on mobile devices, printed, or displayed on large screens.
Integrating Gemini Infographics into Your Content Strategy
Infographics created with Gemini amplify your content marketing efforts across multiple channels. Share them on social media platforms where visual content drives engagement. LinkedIn, Pinterest, and Instagram are particularly effective for infographic distribution.
Embed infographics in blog posts to break up text, illustrate key points, and improve time on page. Search engines favor content that combines quality text with relevant visuals. Use infographics in email campaigns to boost click-through rates and convey complex offers simply.
Create downloadable infographic resources as lead magnets. Valuable visual content encourages email signups and positions your brand as an industry authority. Repurpose infographics into presentation slides, video content, or printed materials to maximize your content ROI.
SEO Optimization for Your Infographics
To ensure your Gemini-created infographics rank well in search results, implement these SEO strategies. Use descriptive file names containing relevant keywords before uploading. Instead of “infographic1.png,” use “sustainable-energy-trends-2025-infographic.png.”
Write comprehensive alt text describing the infographic’s content and key data points. This improves accessibility and helps search engines understand your visual content. Create dedicated landing pages for important infographics with supporting text that provides context, explains the data sources, and includes relevant keywords naturally.
Promote your infographics through social sharing, backlink outreach, and embedding opportunities on other websites. Social signals and quality backlinks indicate content value to search engines. Submit infographics to visual content directories and include structured data markup to enhance search appearance.
Future Trends: AI-Powered Visual Content
The intersection of AI and visual design is rapidly evolving. Google’s Gemini represents the current state of accessible AI design assistance, but capabilities continue expanding. Future developments will likely include real-time collaborative editing where multiple users and AI work simultaneously, advanced personalization allowing infographics that adapt to individual viewer preferences, and automated A/B testing where AI generates and tests multiple design variations.
Expect enhanced multimodal understanding where AI analyzes video, audio, and text to extract infographic-worthy insights automatically. Integration with analytics platforms will enable AI to create infographics directly from your business data with minimal input.
Conclusion: Transform Your Visual Content Creation
Google’s Gemini has fundamentally changed how we approach infographic design. By combining AI intelligence with human creativity, you can produce professional visual content faster and more affordably than ever before. The key to success lies in providing clear direction, iterating based on AI suggestions, and maintaining your unique brand voice.
Start experimenting with Gemini today. Begin with simple projects, learn the prompting techniques that work best for your style, and gradually tackle more complex infographics. As you develop proficiency, you’ll discover that AI isn’t replacing designers—it’s empowering everyone to become one.
The democratization of design through tools like Gemini means compelling visual storytelling is no longer limited to those with technical skills or large budgets. Your ideas, combined with AI capabilities, can create infographics that inform, engage, and inspire audiences worldwide.
Ready to create your first infographic? Open Google’s Gemini and start with a simple prompt describing your topic. The journey from concept to compelling visual begins with a single conversation.